
Solutions > Yellowfin BI Platform
Yellowfin BI Platform
Institutional facilities and campuses have a large list of jobs that you need to plan your services, assign work to technical and support units, and track. Windesk.FM facility and workplace management solution helps you design service categories, run smoothly, make new arrangements, measure service quality and control costs.
Business Intelligence Analysis and Reporting
Business Intelligence Analysis and Reporting
Yellowfin is a Business Intelligence platform that offers all the business intelligence reporting tool opportunities you need to derive value from your operational data. The Yellowfin app consists of a set of modules that allow you to create and share a range of analytics content with end users, whether as a solution for enterprise analytics, as an OEM BI tool for embedded analytics, or as a standalone analytics.
Yellowfin BI High-End Features
- Boards - Smart, beautiful, augmented boards
- Automatic Job Tracking - Insights that find you
- Data Storytelling - Tell the stories in your data
- Self-service BI - Explore and visualize your data
- Embedded Analytics - Deliver more with less code
- Data Preparation - Connect and prepare your data
- Data visualization - See the truth in your data
- Mobile Business Intelligence - Take action anytime, anywhere
Yellowfin Abilities:
Connecting to Data:
Yellowfin doesn't require you to import data, but instead works with data from your existing data sources. Several main datastore types are supported.
Data Conversion:
Yellowfin has a complete ETL module that allows you to extract data from any supported source, transform that data using various conversion steps, and write the output to any writable database target that supports it. This capability is useful when the data you access requires some degree of manipulation or enhancement to make it more suitable for analytical purposes.
Data Science Integration:
Custom-developed data science models can be integrated into Yellowfin via an ETL feed or directly with a report. This way, new data can be integrated into your analytics solution like a forecast.
Metadata Modeling:
Yellowfin provides a comprehensive modeling layer to capture technical and business insights about your core data. Yellowfin uses technical information to generate relevant queries while using this information to provide end users with a business-friendly layer.
Reporting:
After metadata is defined for the underlying data source, reports can be generated using the drag and drop report builder. The report builder allows the creation of even simple tabular reports for incredibly complex queries (for example, related subqueries, joins, crosstabs, etc.). Yellowfin uses report definitions to generate query syntax in a language appropriate for the underlying data source. Although the syntax of the generated queries is accessible, the complexity of defining joins and other syntax is hidden from the user. If desired, queries can be written using freehand SQL.
Data display:
Yellowfin supports a wide variety of ways to visualize report output. This includes tabular or crosstab reports, one of many ready-to-use chart types, or a custom JS chart of your choice.
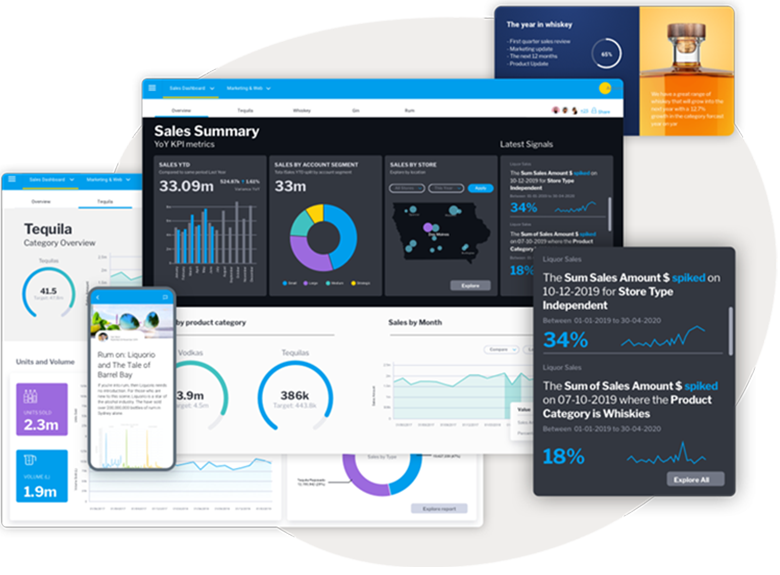
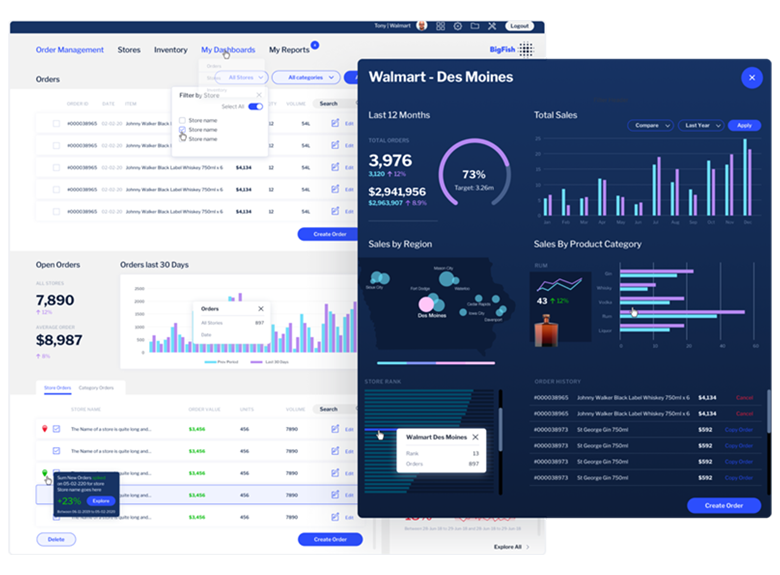
Dashboards:
A dashboard provides at-a-glance views of key performance indicators (KPIs) related to a specific goal or business process. Typically, multiple reports and visualizations are combined to form a Dashboard.
Automated Tracking and Data Discovery:
Yellowfin has developed advanced machine learning capabilities that help users discover and interpret AI-driven data insights. These capabilities increase the user's capabilities and enable them to analyze more data, find more insights and understand the root cause - much faster than a single human could do.
Data Records and Presentations:
Yellowfin provides excellent ways to present and share data to users. Yellowfin Stories enables the creation of a long-form narrative enriched with rich data content (tables, reports) and non-data content (text, images, videos). Inspired by the field of data journalism, Stories offers a much more engaging information delivery process that ensures data is presented with full context and consumers of information are always on the same page.
For more information
Contact Windesk team
491 28 13
